Regrettably, Transport for London’s draft Pedestrian Safety Action Plan (PSAP)
fails from the start. Despite a rough attempt to consider what is meant by the term “pedestrian risk”, it is not clear about what it thinks pedestrian safety is. Having a well formulated set of approaches to the problem – which it doesn’t seem to have anyway – is not really going to be possible if we can’t be certain what the problem is in the first place.
Consultation on the draft finishes on May 9th. Below are our basic objections.
What is pedestrian safety and how do we measure it?
1. The casualty rate question
The basic problem with the draft PSAP is that it has not properly articulated what is meant by pedestrian risk. This involves some way of measuring it, so that we can see whether its level has increased or decreased. The questions involved in doing this are set out here – although the focus is specifically on cyclists’ safety in this article, the issues are the same for pedestrians.
Traditional “road safety” measures the problem for pedestrians as the aggregate number of pedestrians reported as “Killed and Seriously Injured” (KSI) – irrespective of the number of walking journeys, time spent walking, or distance covered by foot. This allows the “road safety” lobby to claim success when overall casualties go down, even if the casualty rate (per distance, journey walked or time spent walking) stays the same or goes up.
To be fair, TfL now do refer to measures of exposure. It is worth quoting this in full:
“This puts understanding risk at the heart of road safety assessment, to target resources where they will be most effective. By looking at KSI casualty figures alongside other data, such as trips, population, journeys and time and distance travelled, we can gain a greater understanding of the risk posed to different road users. This allows us to focus on improving pedestrian safety for those at highest risk, to better identify interventions and focus resources in order to gain the greatest improvements to pedestrian safety.
The risk analysis was undertaken by combining collision and casualty data from
STATS193 with detailed journey data from the London Travel Demand Survey
(LTDS). LTDS is a rolling sample survey of travel by households in London, with an
annual sample size of 8,000 households. It provides accurate quantitative data representative of the diversity of both people and places in London that, over time,
builds up to provide a comprehensive and detailed picture of the travel behaviour of
London residents.
This allows a full and robust profiling of the nature of trips by Londoners – where and
when they travel, by which methods of transport, which combinations of modes… “(PSAP p.9.)
Having said this, the claim to being “robust” is unwarranted. For example, a good way of assessing changes in casualty rate is to look at the data at specific locations which have been re-engineered (“treated”) with pedestrian safety in mind. It should now be easy to measure pedestrian flows in detail at such locations, as well as considering other factors, such as whether there has been additional ease in crossing without having to worry about particular sources of danger, e.g. with increased crossing times at signalled junctions. Instead, the depiction of casualty rates is much cruder, as this heat map (Figure 4) shows. By depicting pedestrian KSIs per billion kilometres walked per Borough, are we actually learning anything?
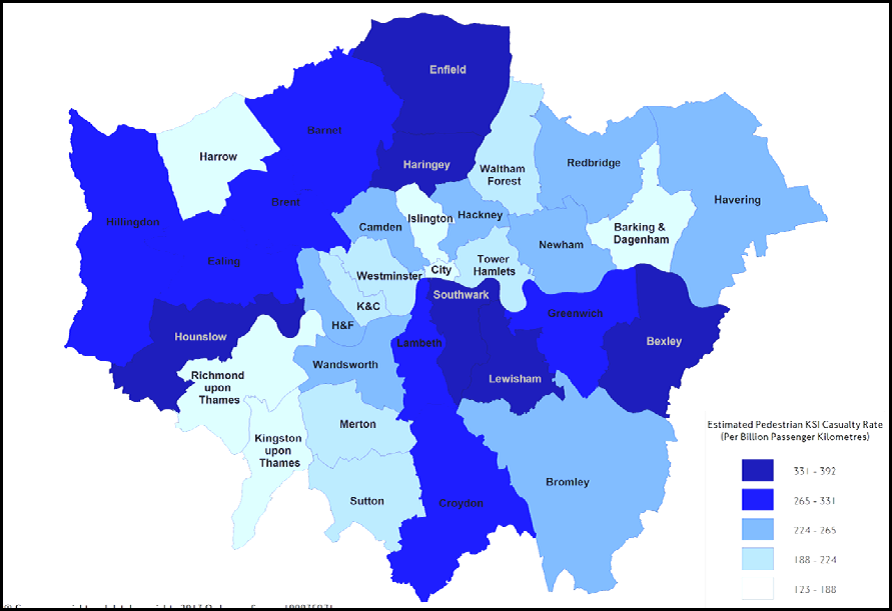
We would, for example, expect pedestrian casualties to be more serious in areas where motor vehicle speeds are higher, which could be why the rate is higher in at least some of the Outer London Boroughs, where there are roads with higher vehicle speeds than in Inner London. But walking trips may well be made on roads in town centres with congested conditions where vehicles are travelling slower and both drivers and pedestrians watching out more: maybe, for example, there are more of these kinds of trip being walked in Bromley than in neighbouring Bexley, accounting for the distance. We can’t really tell.
But even if we do have a more accurate account of pedestrian casualty rates, it is still not clear if TfL actually want to break out of the traditional “road safety” paradigm. So we see that a central aim is:
“A significant reduction in the number of pedestrians killed and seriously injured is central…”p.7
…which can be achieved by having fewer pedestrian trips, particularly those made by elderly or disabled people, who are most likely to become KSIs in collisions because of greater frailty.
Now, TfL do say:
“The challenge is to meet the demands of more walking and simultaneously reduce
the total number of pedestrians that are involved in collisions when using our streets”.p.6
But which is more important? If the number of walking journeys doubled, and the total number of pedestrian KSIs stay the same, or increase by, say, 20%, we could say that the chances of being hurt or killed on a given journey appear to have dramatically decreased. Most of us walking about would think that a step forward (pun intended). But would TfL?
2. More danger can lead to fewer casualties
The Road Danger Reduction Forum and our predecessors have spent years pointing out that locations where motor vehicles pose particularly high levels of danger to people walking and cycling can lead to people being less likely to cycle, walk (or allow their children to walk or cycle there). This leads to low numbers of cyclist/pedestrian casualties: this is traditionally an indicator for the “road safety” lobby of less of a safety problem when in fact there is more danger.
Now, TfL do say:
“Roads that are perceived to be busy and unsafe may deter people from making a journey on foot.” P.12
There are other issues – these locations may be deterring walking because of noise pollution, the visual intrusion of motor traffic and noxious emissions. However, there is danger and it is often not just a “perception”, these roads – or to be more precise, the use or abuse of the motor vehicles on them – are indeed particularly unsafe.
“A high number of pedestrian collisions at a particular location may indicate that there is a specific problem that needs adressing to improve safety” p.13
But a low number may indicate a particular problem. No recognition of that.
There is a question as to how we might measure the levels of danger posed at such locations, although, as Basil Fawlty might have said, it is often “bleedin’ obvious”. But are TfL actually attempting to do this? As far as I can see, the only measures being used in “Extensive data analysis… (to)… identify the places where pedestrians are at greatest risk in London ” p.3. are still KSI based, rather than on actual danger.
3. Different groups
Newcomers to the world of road safety statistics may be interested by items such as Figure 3. Risk path showing pedestrian risk and KSI numbers by age group which shows that 20 – 29 year olds are the age group with the highest number of KSIs, yet a risk per distance walked about one-third of the 75+ group, who have about half as many KSIs as the 20 -0 29 year olds. The explanation is that 20 -29 year olds are far more likely to be walking (more KSIs), while the 75+ group are far more frail and likely to be reported as KSI when they are hit.
The thing is: so what? How exactly does this help us in an attempt to do what we should be doing? Allegedly this is about targeting scarce resources. Actually what it is likely to mean is the production of publicity initiatives aimed at these different groups which is at best ineffective and at worst victim-blaming – and which may only “work” by scaring the “targets” away, such as in a recent TfL campaign.
What are we actually going to do about it?
All the above relates to the central point of what we are all supposed to do to achieve pedestrian safety – even if we know how to define what it is, which so far is up for debate. (Again, consider the discussion about the aims of achieving safety in a civilised society here https://rdrf.org.uk/2013/11/15/if-we-want-safer-roads-for-cycling-we-have-to-change-how-we-measure-road-safety/ ).
1. An example: Speed
“…the significant majority of collisions took place on roads with a 30mph limit. Almost half of the vehicles involved were exceeding the limit, and where the limit was exceeded, this was sometimes by very substantial margins”. PSAP p.16. There is discussion in PSAP about further introduction of 20 mph (but not about how to achieve compliance with 20 mph in these areas) and some about replacing defective speed cameras. None of the discussion mentions that speed cameras are only located where a threshold of incidents has been recorded – again, focussing on the collisions rather than the background danger. Nor that a substantial proportion of those found on speed cameras are not prosecuted because their vehicles are unregistered.
None of this augurs well for an effective speed control strategy.
2. Not just pedestrians.
What this leads on to is how addressing speed issues for pedestrians (and the issue of unregistered drivers, and not just because they can avoid speed camera detection) would be of benefit for the safety of all road users. The problem is that a “road safety” analysis of the PSAP type, by being victim based, tends to divert attention away from danger reduction – from reducing danger at source, namely from the (often inappropriate, rule or law breaking) use of motor vehicles. Even without a degree of victim-blaming, it simply misses out on what would be desirable for all road users.
3. What “works”.
A crucial issue is that the “road safety” approach does not recognise that many reductions in road collision casualties have occurred because of changes in general levels of risk taking in society, changes in the quality of medical care, or other factors which have nothing to do with “road safety” initiatives – as well as the declines in walking and cycling mentioned above.
But ultimately the issue of deciding what programme to pursue depends on what we are trying to achieve – we won’t know whether something has worked or not until we agree on this. So far this is not clear in PSAP.
We humbly suggest that an approach based on a more rational discussion of what safety on the road is, and the commitment towards reducing danger at source as the civilised way of achieving it, is the way forward.
