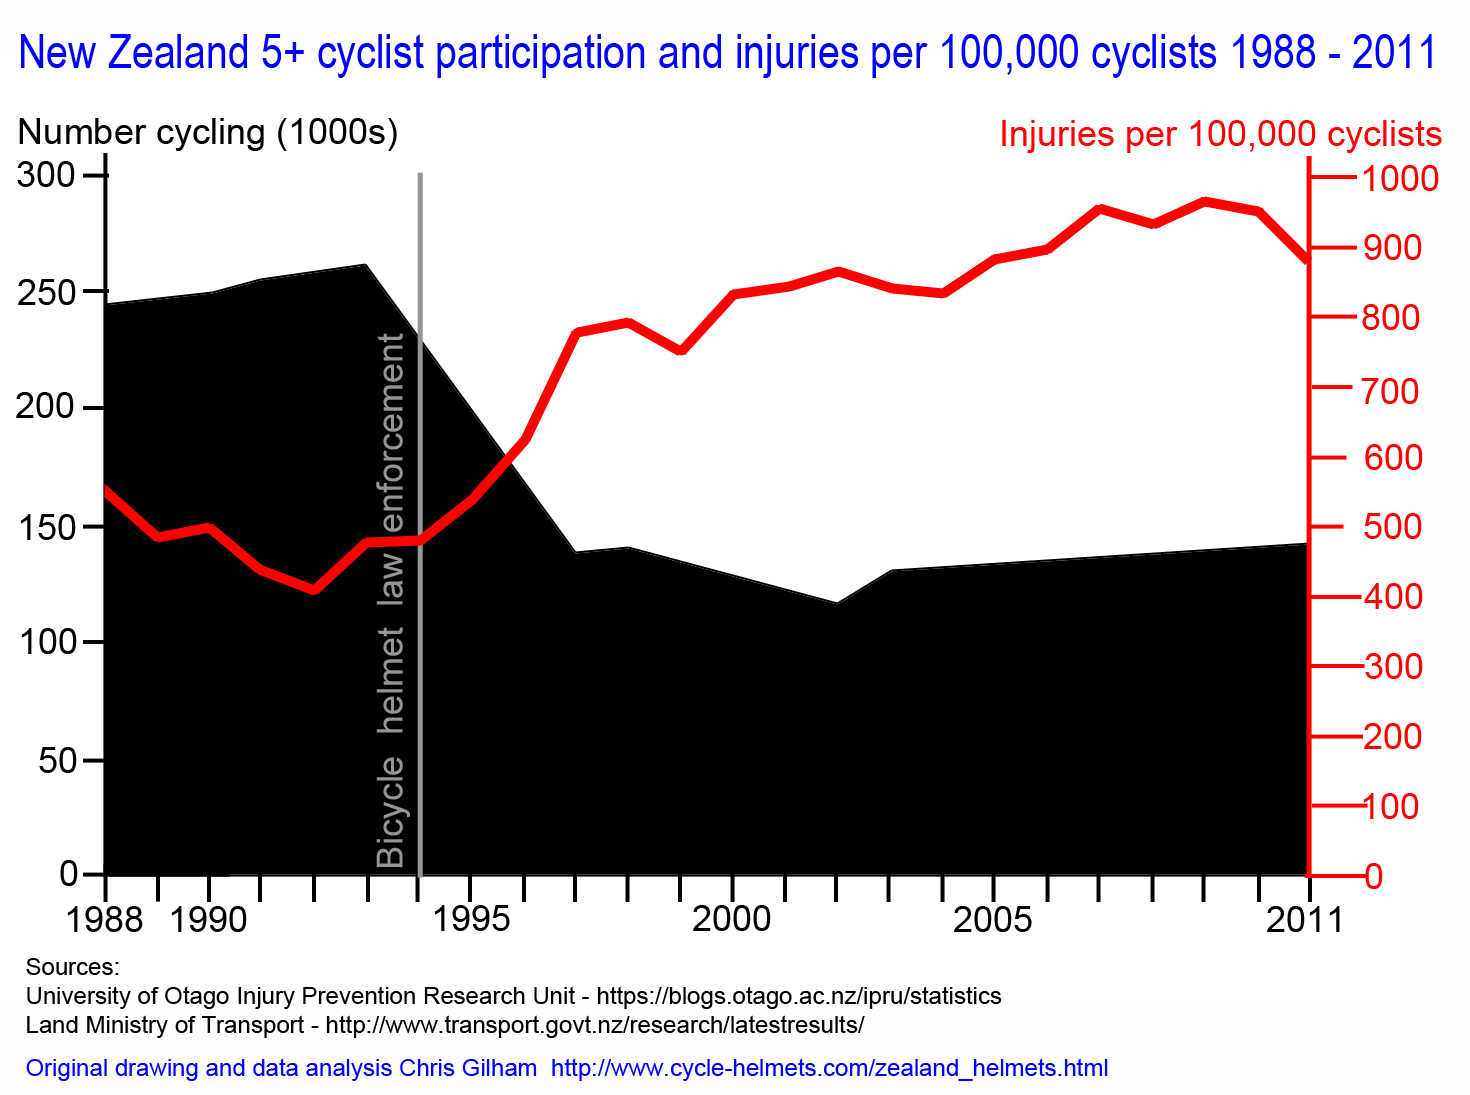
Below is a graph by Chris Gilham looking at cycling (those of all ages over 5) in New Zealand. Look at levels of cycling and the cyclist injury rate following the introduction of the mandatory cycle helmet law. More to come on the analysis of this graph in the next post.
 For more detailed evidence on the effect of the NZ law, and what it means, see our post here

Pingback: Plotting Data That Doesn’t Exist is a Bad Idea | Injury Stats
Pingback: Anarchist History of New Zealand
Pingback: Anarkiwi